Snip
|
Canvas Visualizations of Sorting Algorithms canvas, java... Willison, I was made aware of an old but interesting pos... visualizing of sorting algorithms. Aldo Cortesi explains...
|
|---|
Categories |
|
|---|
For Snip |
loading snip actions ... |
|---|---|
For Page |
loading url actions ... |
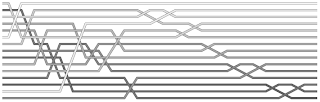 Via Simon Willison, I was made aware of an old but interesting post dealing with visualizing of sorting algorithms. Aldo Cortesi explains his dislike for animated visualizations and argues that their explanatory power equals that of a "glob of porridge flung against a wall".
He decided to make something better and ended up with some pretty cool static visualizations rendered with Python using the Cairo graphics library. Now, I don't know if these are really that much more informing than other attempts (especially if you're comparing algorithms), but I do think they're quite pretty.
Anyway, I thought they could use a little
canvas love so I've spent my morning making a quick and dirty JavaScript / canvas port of Aldo's original Python program. It's a bit rushed and I don't have much experience with Python, so I might have missed a few details in the code, but it looks to be producing similar results.
HTML |
<span class="title"><a href="http://blog.nihilogic.dk/2009/04/canvas-visualizations-of-sorting.html">Canvas Visualizations of Sorting Algorithms</a> </span> <span class="tags"> <span class="post-labels"> <a class="label" href="http://blog.nihilogic.dk/search/label/canvas" rel="tag">canvas</a>, <a class="label" href="http://blog.nihilogic.dk/search/label/javascript" rel="tag">javascript</a> </span> </span> <span class="content"> <img src="http://1.bp.blogspot.com/_OjchJpvqFiw/SeW6V7piWpI/AAAAAAAAAks/bMryhXEMUl0/s320/sorting_vis.png" style="margin-right: 10px; float: left;" border="0"> Via <a href="http://simonwillison.net/2009/Apr/14/sort/">Simon Willison</a>, I was made aware of an old but interesting post dealing with <a href="http://www.hatfulofhollow.com/posts/code/visualisingsorting/index.html">visualizing of sorting algorithms</a>. Aldo Cortesi explains his dislike for animated visualizations and argues that their explanatory power equals that of a "glob of porridge flung against a wall". <span class="full-article"> <br><br> He decided to make something better and ended up with some pretty cool static visualizations rendered with Python using the <a href="http://cairographics.org/">Cairo</a> graphics library. Now, I don't know if these are really that much more informing than other attempts (especially if you're comparing algorithms), but I do think they're quite pretty. <br><br> Anyway, I thought they could use a little <code>canvas</code> love so I've spent my morning making a quick and dirty JavaScript / <code>canvas</code> port of Aldo's original Python program. It's a bit rushed and I don't have much experience with Python, so I might have missed a few details in the code, but it looks to be producing similar results. </span></span> |
|---|